Microsoft Visio: Complete Guide to Creating Professional Flowcharts & Diagrams

Callum specializes in breaking down complex technology topics into easy-to-understand guides. He has a background in computer science and technical writing.
Microsoft Visio: Complete Guide to Creating Professional Flowcharts & Diagrams
Microsoft Visio is the leading tool for creating professional diagrams, from simple flowcharts to complex network diagrams and org charts. Learn to master Visio to visualize processes, data, and structures clearly and professionally.
What is Microsoft Visio?
Microsoft Visio is a diagramming and vector graphics application that's part of the Microsoft 365 ecosystem. It enables you to create professional diagrams to visualize complex processes, organizational structures, floor plans, network diagrams, and much more.
Why Use Visio?
Effective visual communication
Transform complex information into easy-to-understand diagrams
Standardization
Use industry-standard symbols and notations
Microsoft 365 integration
Works seamlessly with Word, Excel, PowerPoint, and Teams
Real-time collaboration
Work with your team on the same diagram simultaneously
Professional templates
Hundreds of ready-to-use templates
Dynamic data
Link diagrams to real-time data sources
Visio Versions
| Version | Features | Ideal For |
|---|---|---|
| Visio Web App | Free basic browser version | Simple occasional diagrams |
| Visio Plan 1 | Web subscription with premium templates | Occasional users |
| Visio Plan 2 | Desktop + Web + all features | Professionals and teams |
| Visio 2021 | One-time purchase, perpetual use | Users without subscription |
Visio Interface
Main Interface Elements
Ribbon
Contains all tools organized in tabs: Home, Insert, Design, Data, Process, Review, and View
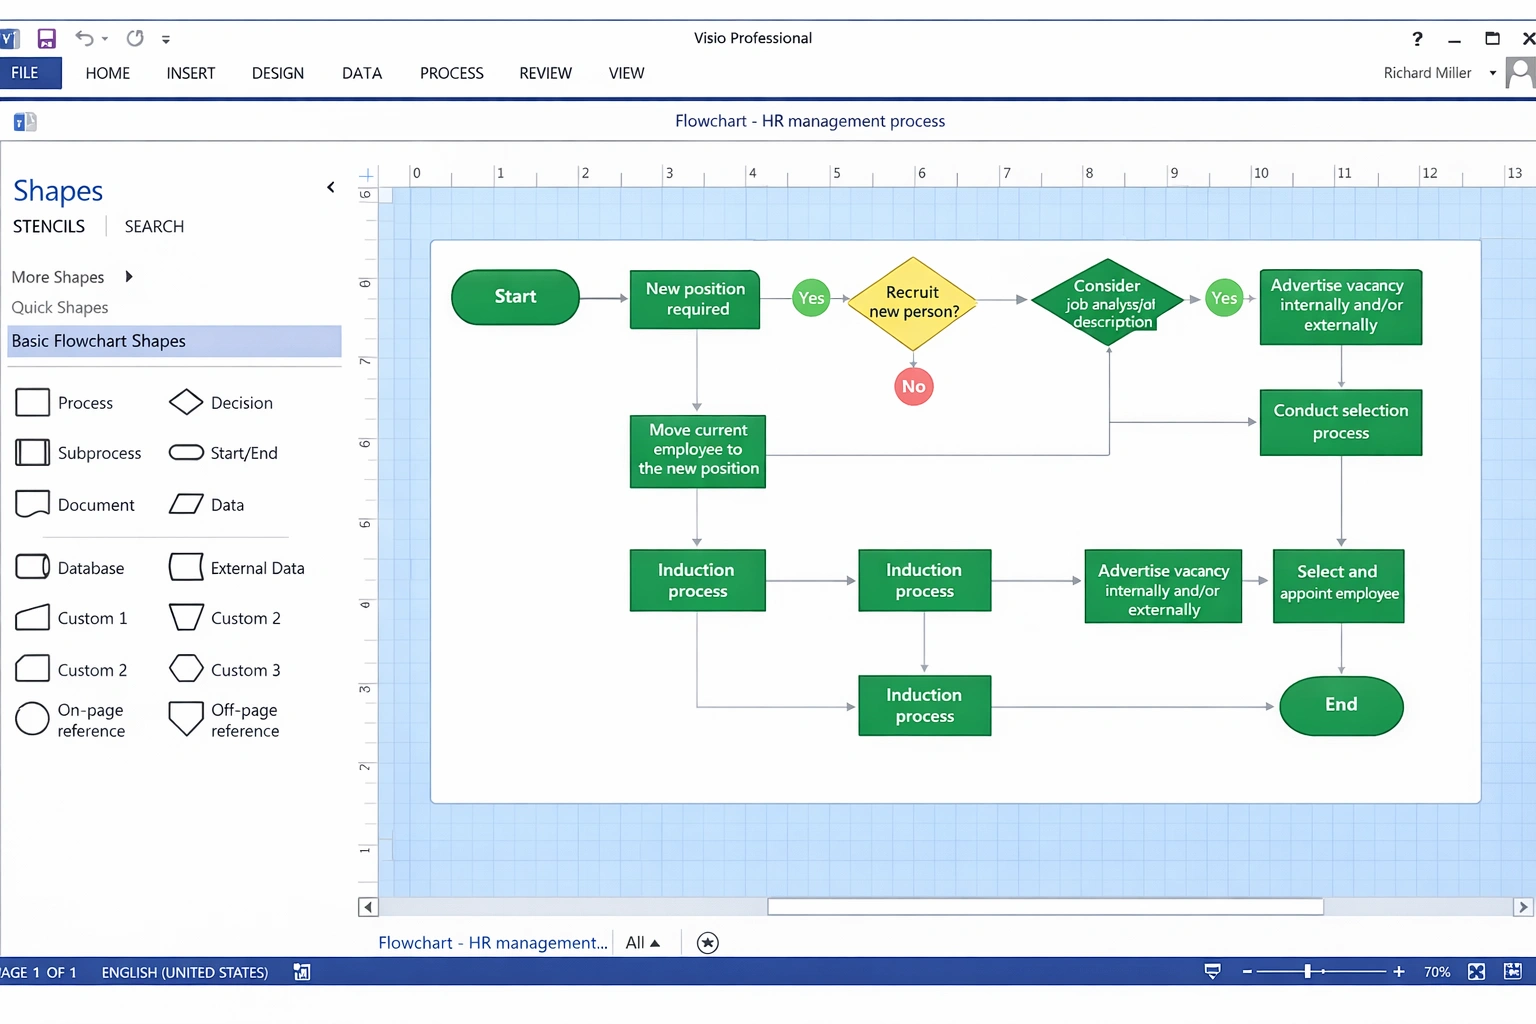
Shapes panel
Library of shapes available for the selected diagram type. Drag and drop shapes to the canvas
Drawing canvas
Main area where you create and edit your diagram. Supports zoom and panning
Task pane
Contextual panels for formatting, navigating, and managing the diagram
Document pages
Tabs at the bottom for managing multiple pages in a document
Essential Keyboard Shortcuts
Types of Diagrams
Visio offers templates for dozens of diagram types. Here are the most popular:
Flowcharts
Visualize step-by-step processes with decisions and outcomes
Org Charts
Hierarchical structure of organizations and teams
Network Diagrams
IT infrastructure, connections, and devices
Floor Plans
Physical space design and layout
UML Diagrams
Software and system modeling
Mind Maps
Ideas and concepts connected visually
BPMN Diagrams
Standard notation for business processes
Timelines
Events and milestones in temporal sequence
Create Your First Flowchart
Step by Step: Basic Flowchart
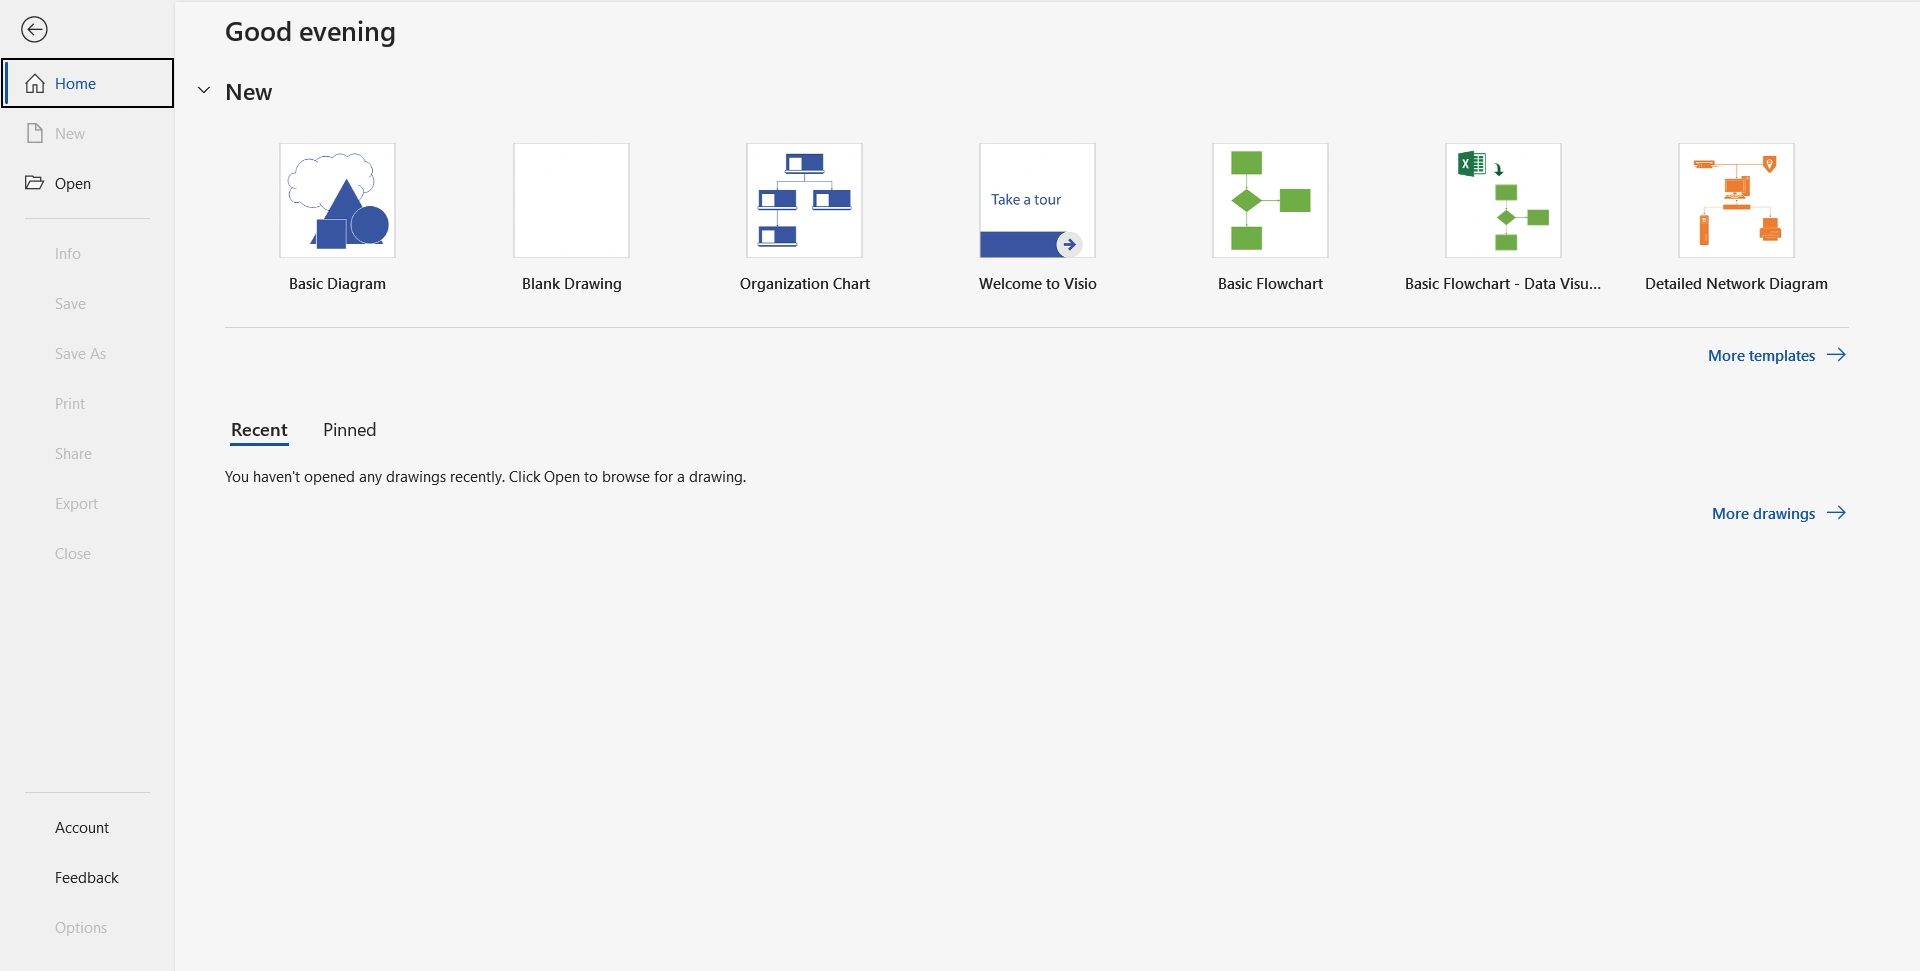
Open Visio and select 'Basic Flowchart' from templates
The shapes panel will show standard flowchart shapes
Drag a 'Terminator' (oval) to the canvas to indicate the start
Add 'Process' shapes (rectangles) for main steps
Use 'Decision' (diamonds) for branching points
Connect shapes using the Connector tool (Ctrl+3)
Add text by double-clicking on each shape
End with another 'Terminator' to indicate the process end
Standard Flowchart Symbols
| Symbol | Name | Use |
|---|---|---|
| ⬭ | Terminator (Oval) | Start and end of process |
| ▭ | Process (Rectangle) | Action or process step |
| ◇ | Decision (Diamond) | Yes/No branching point |
| ▱ | Data (Parallelogram) | Data input or output |
| ⬒ | Document | Document generated or used |
| → | Arrow | Flow direction |
| ○ | Connector | Reference to another part of diagram |
Keep your flowchart reading top to bottom and left to right. Decisions should have exactly two clearly labeled exits (Yes/No or True/False).
Shapes and Connectors
Working with Shapes
Resize
Drag corner or side handles
Rotate
Use the circular handle above or specify exact angle
Align
Select multiple shapes and use Home → Align
Distribute
Uniform spacing with Position → Distribute
Group
Ctrl+G to treat multiple shapes as one
Order
Bring to front/Send to back for layers
Connector Types
Dynamic connector
Automatically adjusts when you move shapes. Ideal for most diagrams.
Straight connector
Direct line between two points. Useful for simple diagrams.
Right-angle connector
Turns at 90° angles. Standard for technical diagrams.
Curved connector
Smooth, curved lines. Best for visual or artistic diagrams.
Connection Points
Shapes have connection points (small blue x's) where connectors attach:
Formatting and Styles
Applying Themes
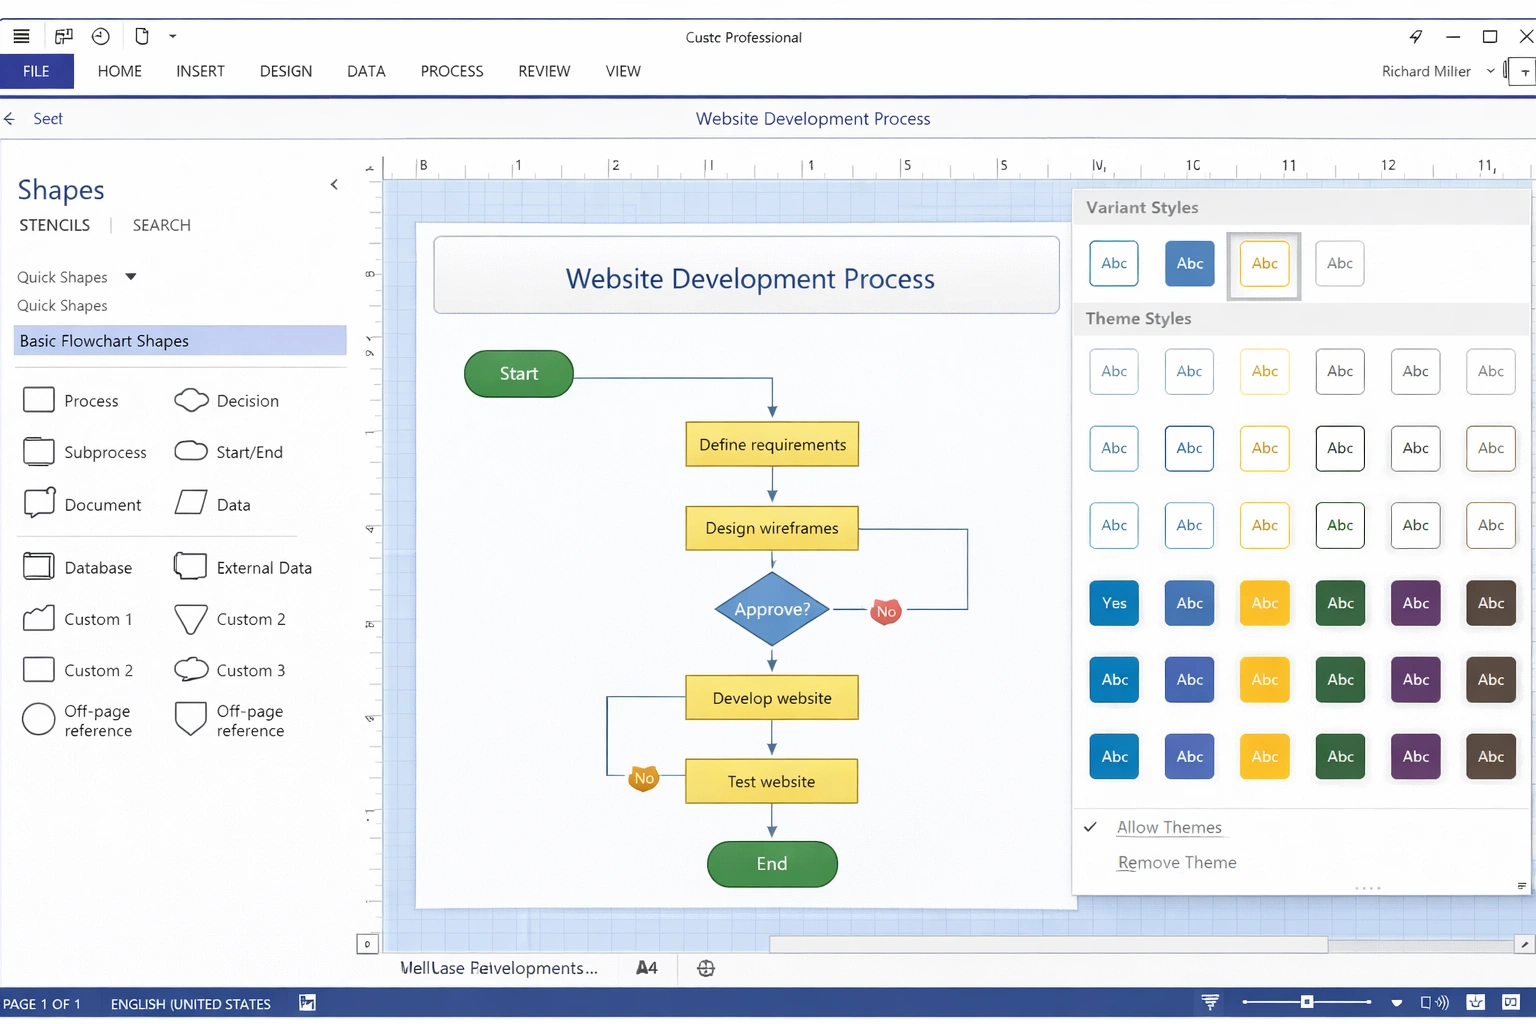
Themes apply consistent color combinations and effects across the entire diagram:
Go to the Design tab in the ribbon
Browse the Themes gallery to see previews
Click a theme to apply it immediately
Use Variants to adjust colors within the chosen theme
Individual Shape Formatting
Fill
Solid color, gradient, pattern, or image
Line
Color, weight, style (solid, dashed, etc.)
Shadow
Add depth with customizable shadows
3D Effects
Bevel, 3D rotation for eye-catching diagrams
Text
Font, size, color, alignment within shapes
Transparency
Adjust opacity for overlay effects
Professional Templates
Visio includes professionally designed templates to accelerate your work:
Business
Workflow diagram, Value chain, SWOT analysis, Six Sigma
Engineering
Electrical diagram, P&ID, Block diagram, Circuits
IT & Network
Rack, Detailed network, Active Directory, Azure/AWS
Software
UML, Database, Wireframe, User flow
Project Management
Timeline, Gantt, Calendar, PERT
Maps & Floor Plans
Floor plan, Evacuation plan, Office layout
You can create your own custom templates. Design a base diagram with shapes, styles, and settings, then save it as a template (.vstx) for reuse.
Team Collaboration
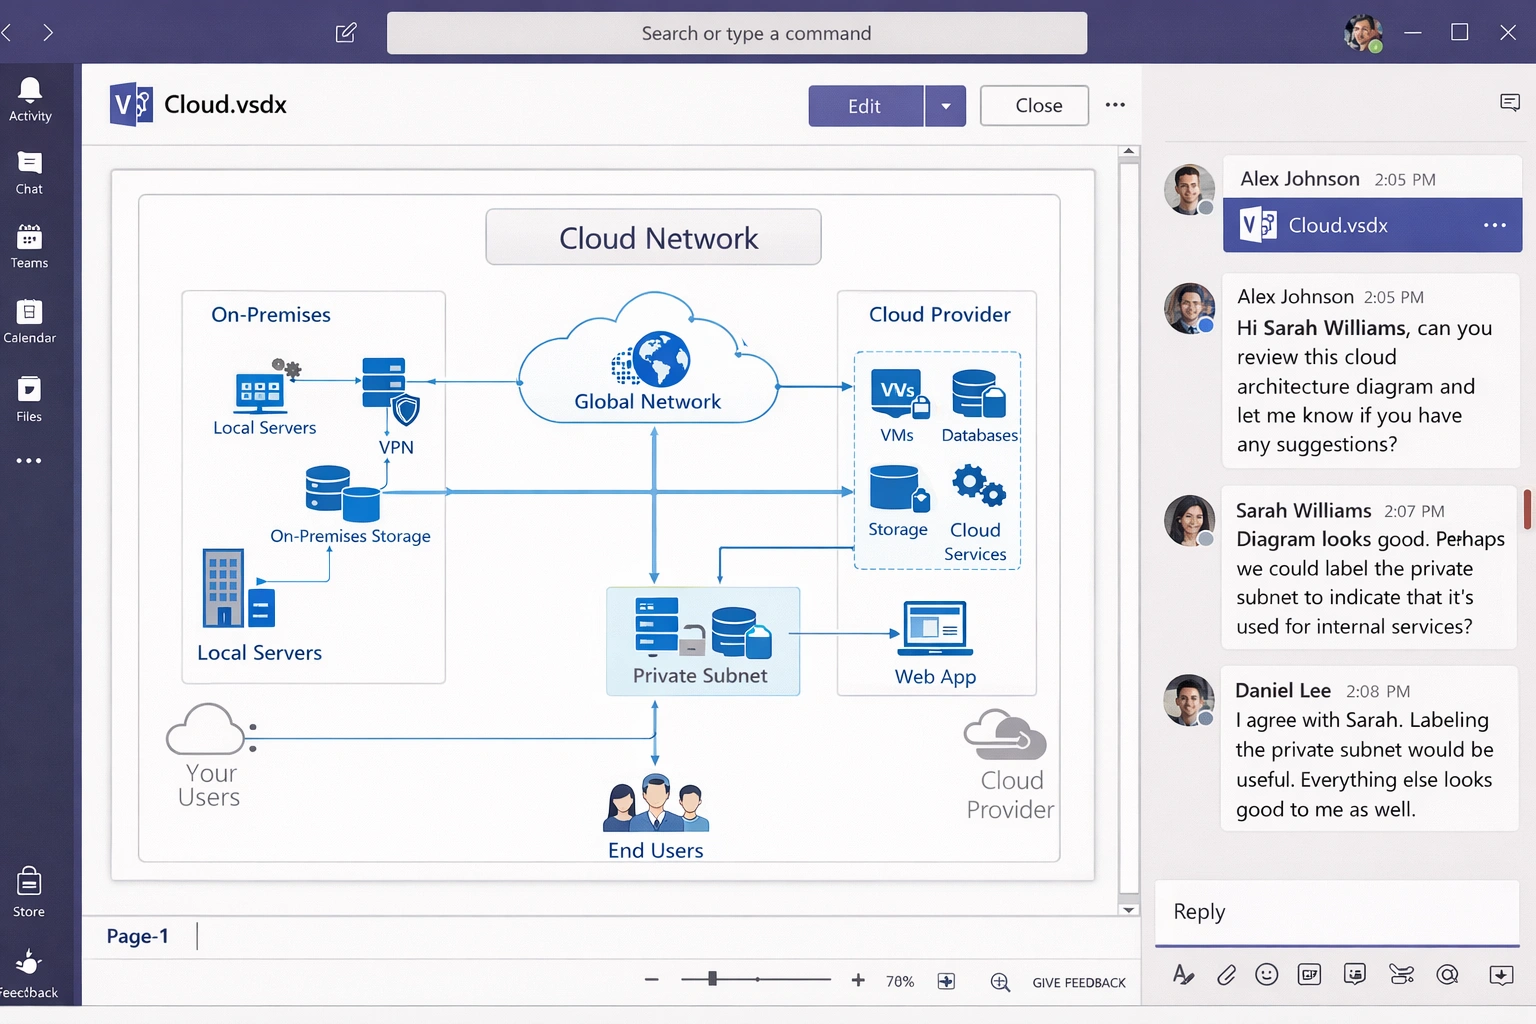
Real-Time Co-authoring
Microsoft Teams Integration
Visio integrates seamlessly with Microsoft Teams:
Advanced Tips
Data Linking
Layers and Organization
Automation with Macros
Diagram Validation
Conclusion
Microsoft Visio is the ultimate tool for creating professional diagrams. Whether you need to visualize a business process, design a network infrastructure, or create an org chart, Visio provides the tools to do it clearly and professionally.
Start with templates, master basic shapes and connectors, and gradually explore advanced features like data linking. With practice, you'll be able to create diagrams that communicate complex ideas effectively.
A good diagram can explain in seconds what would take paragraphs of text. Master Visio and transform the way you communicate complex information.