Microsoft Project: Complete Guide to Project Management & Gantt Charts

Callum specializes in breaking down complex technology topics into easy-to-understand guides. He has a background in computer science and technical writing.
Microsoft Project is the most powerful project management tool in the enterprise market. In this complete guide, you'll learn to master Project from scratch, create professional Gantt charts, manage resources efficiently, and deliver projects on time and within budget.
1. What is Microsoft Project?
Microsoft Project is project management software designed to help project managers develop plans, assign resources, track progress, manage budgets, and analyze workloads. It's used by millions of professionals worldwide.
Key Features
📊 Project Planning
Create detailed schedules with tasks, milestones, dependencies, and deadlines.
📈 Gantt Charts
Visualize the project schedule with interactive bars and dependencies.
👥 Resource Management
Assign people, equipment, and materials. Automatically detect overallocations.
💰 Cost Control
Track budgets, actual costs, and variances.
Available Versions
- Project Standard: For individual users with basic planning features.
- Project Professional: Includes advanced collaboration and Project Server sync.
- Project Online: Cloud version accessible from anywhere.
- Project for the Web: Simplified version included in Microsoft 365.
2. Getting Started with Microsoft Project
Installation and Initial Setup
- Download and install: Get Project from your Microsoft 365 subscription or as a perpetual license.
- Activate your license: Sign in with your Microsoft account to activate the product.
- Configure preferences: Adjust language, date format, and auto-save options.
- Explore templates: Review available templates for different project types.
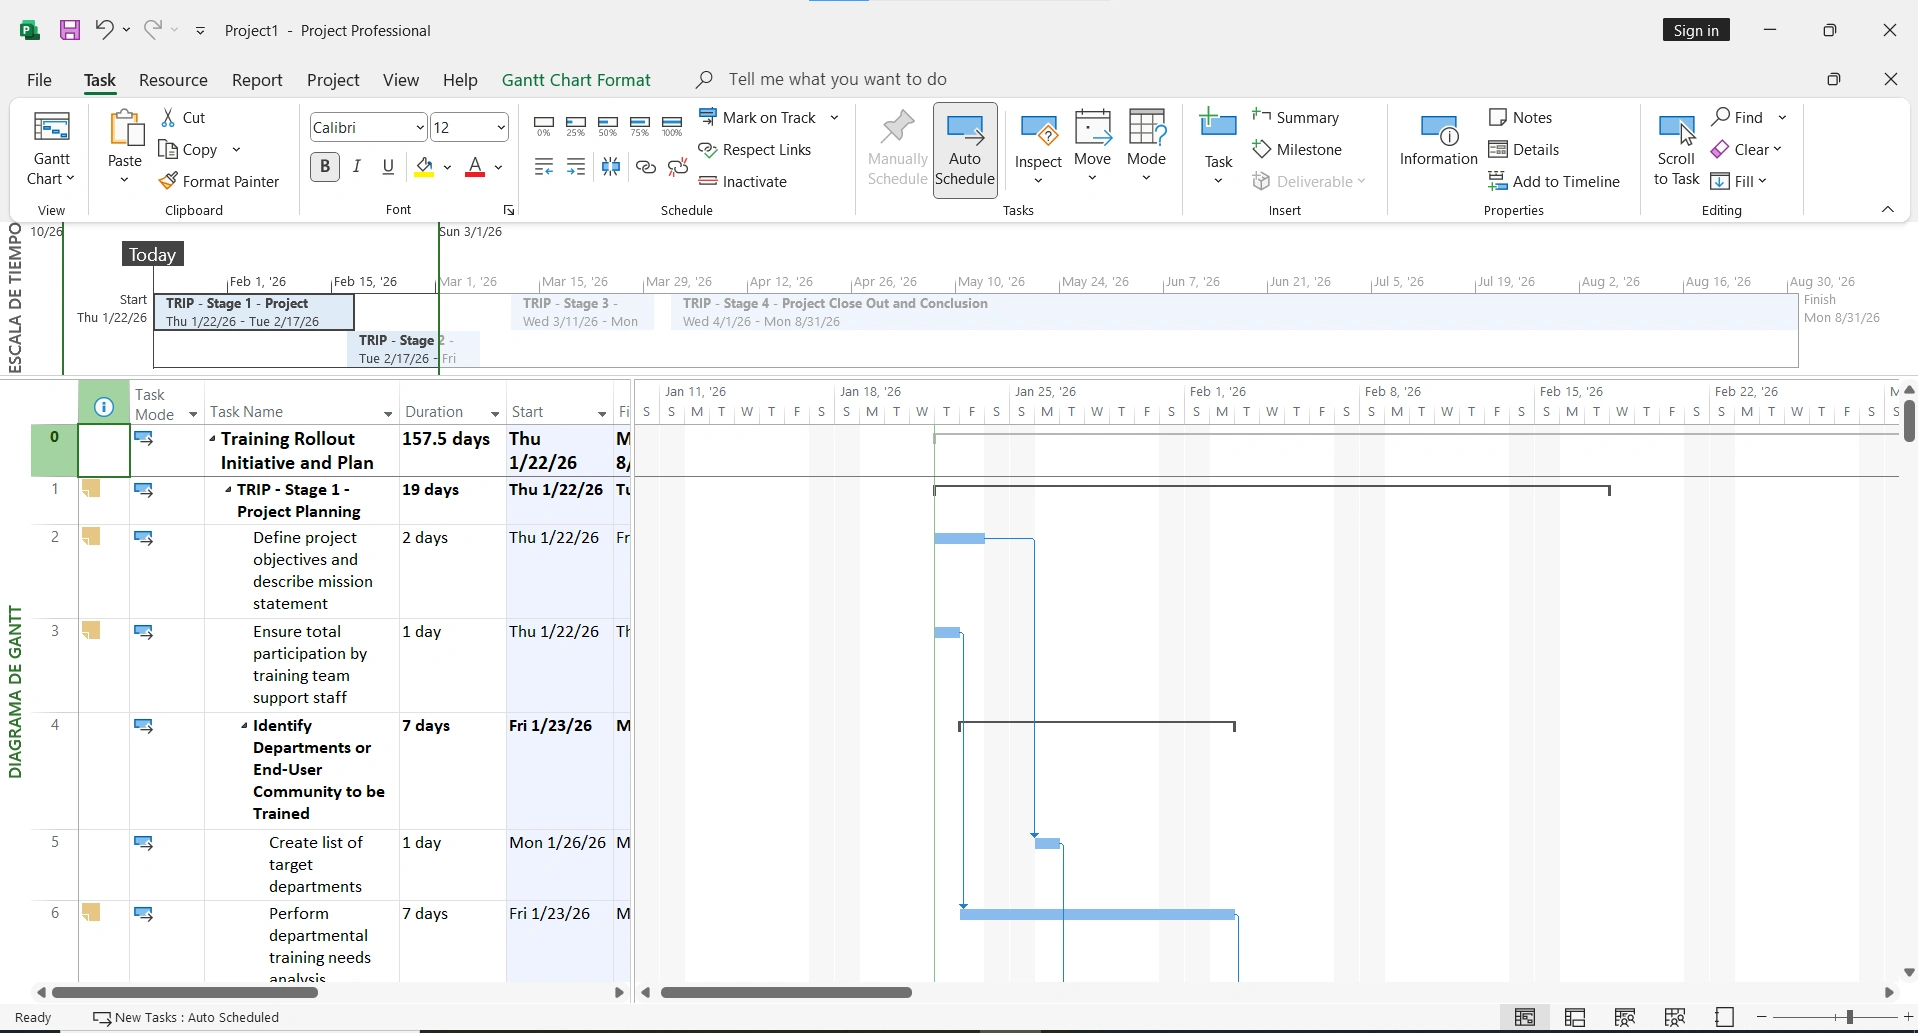
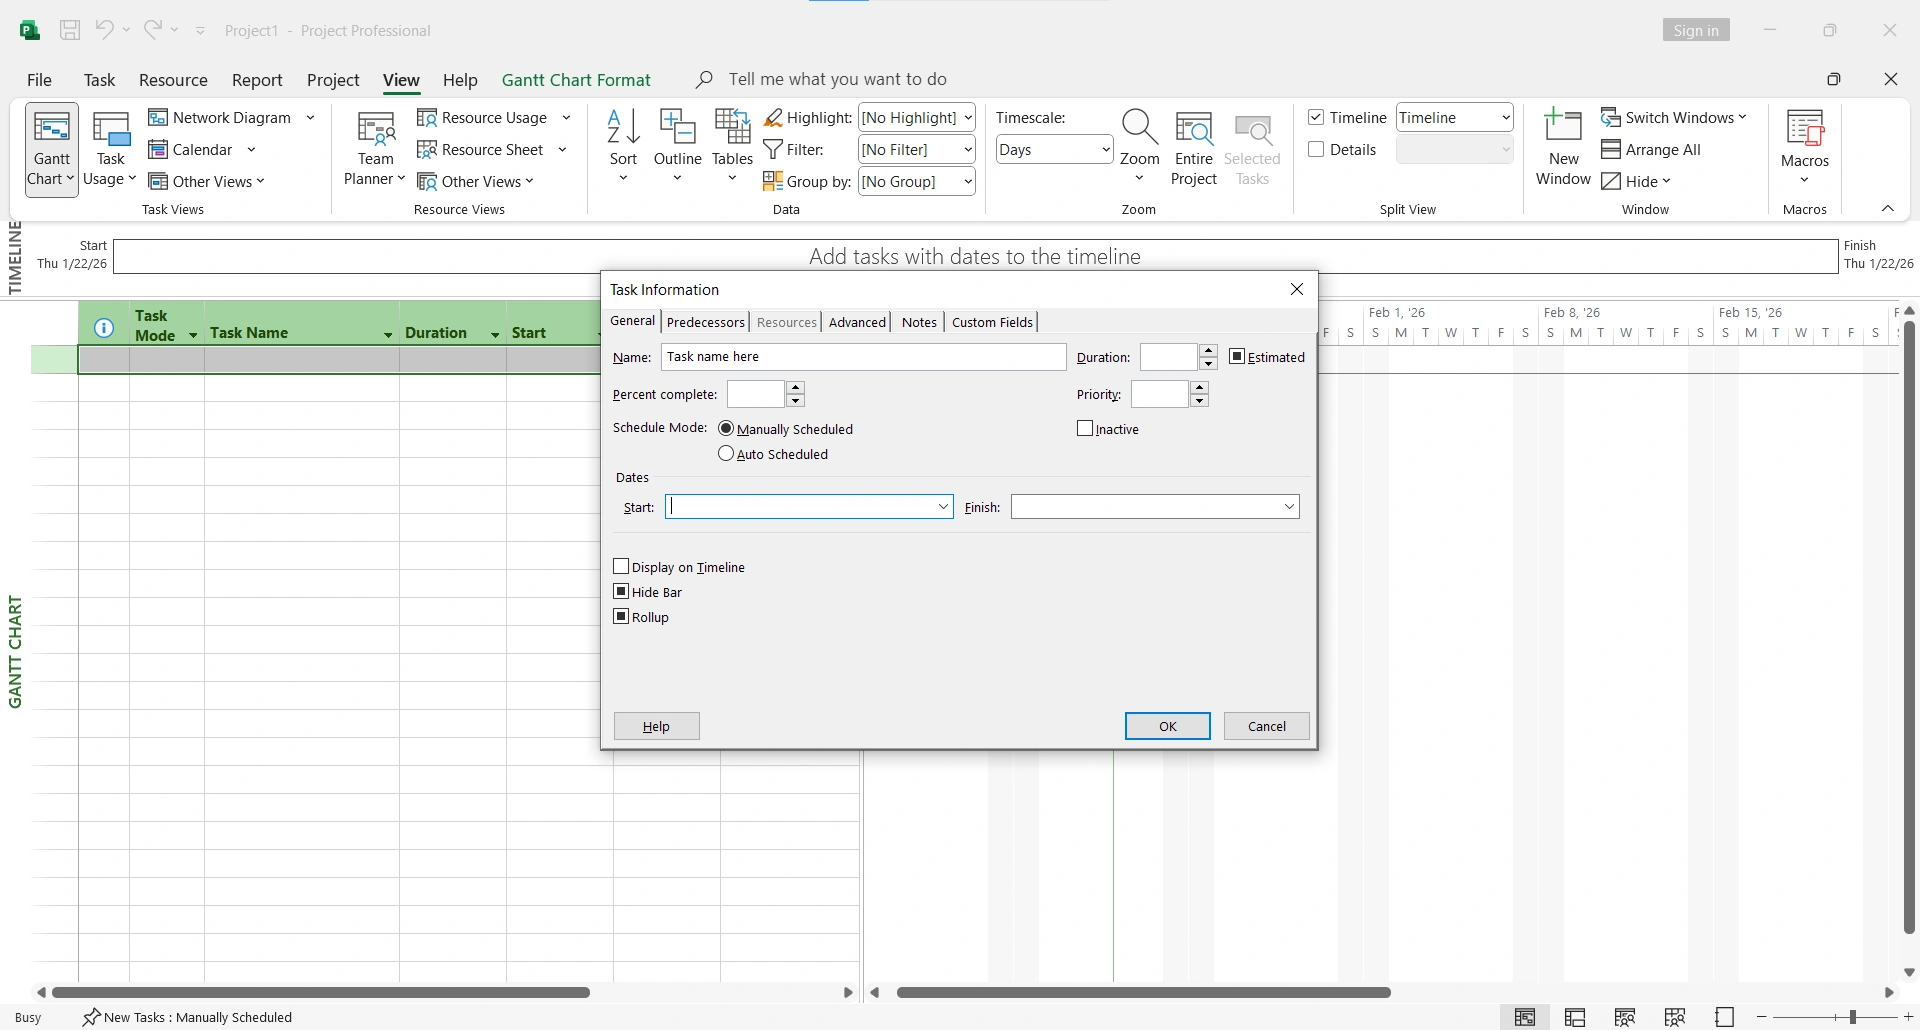
User Interface
The Microsoft Project interface is divided into several key areas:
- Ribbon: Access to all tools organized by tabs.
- Gantt View: The main area where you'll see tasks and the Gantt chart.
- Task Table: Lists all tasks with their properties in columns.
- Timescale: Shows the project calendar at the top of the Gantt.
- Status Bar: Project information and shortcuts to views.
3. How to Create a Project Step by Step
Step 1: Define Project Information
- Go to Project → Project Information
- Set the project start date
- Define the base calendar (Standard, 24 Hours, Night Shift)
- Optionally, schedule from finish date for backward planning
Step 2: Create the Work Breakdown Structure (WBS)
The WBS organizes your project into phases and manageable tasks. In Project, this is achieved through summary tasks and subtasks.
1. Planning Phase (summary task)
1.1 Define scope
1.2 Identify stakeholders
1.3 Create initial schedule
2. Execution Phase (summary task)
2.1 Develop product
2.2 Quality testing
Step 3: Set Durations
For each task, define how long it will take:
- d: days (e.g., 5d = 5 days)
- h: hours (e.g., 16h = 16 hours)
- w: weeks (e.g., 2w = 2 weeks)
- min: minutes (e.g., 30min)
Step 4: Create Dependencies Between Tasks
Dependencies define the logical order of tasks:
| Type | Description | Example |
|---|---|---|
| FS (Finish-Start) | Task B starts when A finishes | Design → Development |
| SS (Start-Start) | B starts when A starts | Parallel tasks |
| FF (Finish-Finish) | B finishes when A finishes | Review with delivery |
| SF (Start-Finish) | B finishes when A starts | Rarely used |
4. Mastering Gantt Charts
The Gantt chart is the most powerful visual representation of your project. It shows tasks as horizontal bars along a timescale.
Gantt Chart Elements
🔵 Task Bars
Represent the duration of each task. Color can indicate status.
🔶 Milestones
Diamonds marking important events or deliverables with no duration.
📊 Summary Bars
Group subtasks and show the total duration of a phase.
🔗 Dependency Lines
Arrows connecting related tasks showing workflow.
Customizing the Gantt Chart
- Change bar colors: Format → Bar Styles → Select category and color
- Show percent complete: Format → Show → Show Complete Through
- Adjust timescale: Right-click timescale → Timescale
- Show critical path: Format → Critical Path (highlights in red)
💡 Pro Tip: The Critical Path
The critical path shows the longest sequence of dependent tasks. Any delay in these tasks will delay the entire project. Always monitor the critical path closely.
5. Resource and Team Management
Types of Resources in Project
- Work: People who perform tasks (developers, designers).
- Material: Consumables used (construction materials, supplies).
- Cost: Expenses not dependent on work (travel, licenses, equipment).
Create and Configure Resources
- Go to View → Resource Sheet
- Enter the resource name in the "Resource Name" column
- Select the type (Work, Material, Cost)
- Define standard rate and overtime rate
- Set maximum availability (e.g., 100% = full-time)
Assign Resources to Tasks
Method 1: Resource Names Column
In Gantt view, add the "Resource Names" column and type the resource name.
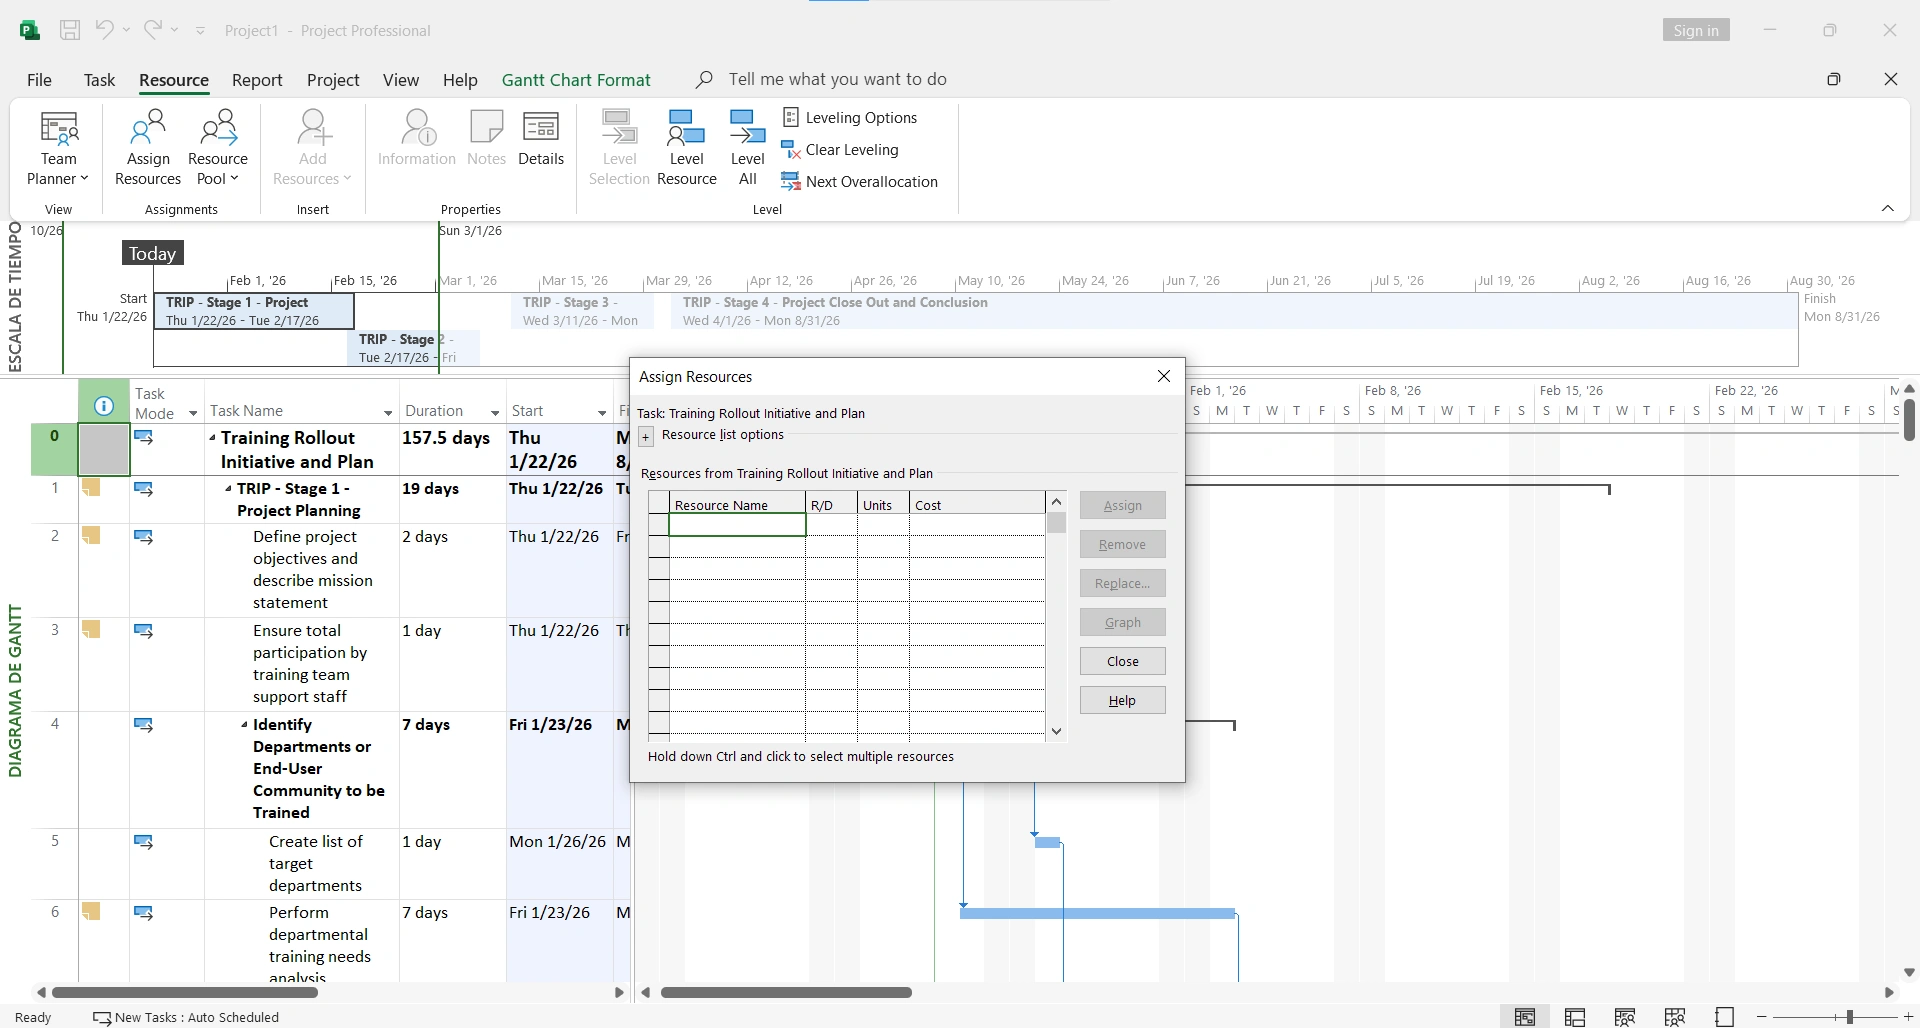
Method 2: Assign Resources (Ctrl + F9)
Select the task, press Ctrl+F9, and select resources to assign.
Detect and Resolve Overallocations
An overallocation occurs when a resource has more work than they can perform in the available time. Project shows these with a red indicator.
To resolve overallocations:
- Auto-level resources: Resource → Level Resources
- Add more resources to the task
- Extend the task duration
- Delay the task until the resource is available
6. Tracking Project Progress
Setting the Baseline
The baseline saves a "snapshot" of the original plan to compare against actual progress.
- Completely finalize your initial plan
- Go to Project → Set Baseline → Set Baseline
- Select "Entire project" and confirm
Updating Progress
| Field | Description |
|---|---|
| % Complete | Percentage of work done (0-100%) |
| Actual Work | Hours actually worked |
| Actual Cost | Expenses incurred to date |
| Actual Start | When the task actually started |
| Actual Finish | When the task actually ended |
Tracking Gantt View
The Tracking Gantt view compares the original plan (baseline) with actual progress:
- Gray bars = Original plan (baseline)
- Blue bars = Current progress
- Red bars = Critical path tasks that are delayed
7. Advanced Project Features
Earned Value Management (EVM)
Earned Value allows you to objectively measure project performance by comparing planned work vs. work performed vs. actual cost.
PV (Planned Value)
Authorized budget for scheduled work.
EV (Earned Value)
Value of work actually completed.
AC (Actual Cost)
Cost incurred for work performed.
Custom Fields
Create custom fields to add specific information to your projects:
- Go to Project → Custom Fields
- Select the field type (Text, Number, Date, etc.)
- Rename it (e.g., "Priority," "Department," "Risk")
- Define formulas or value lists if needed
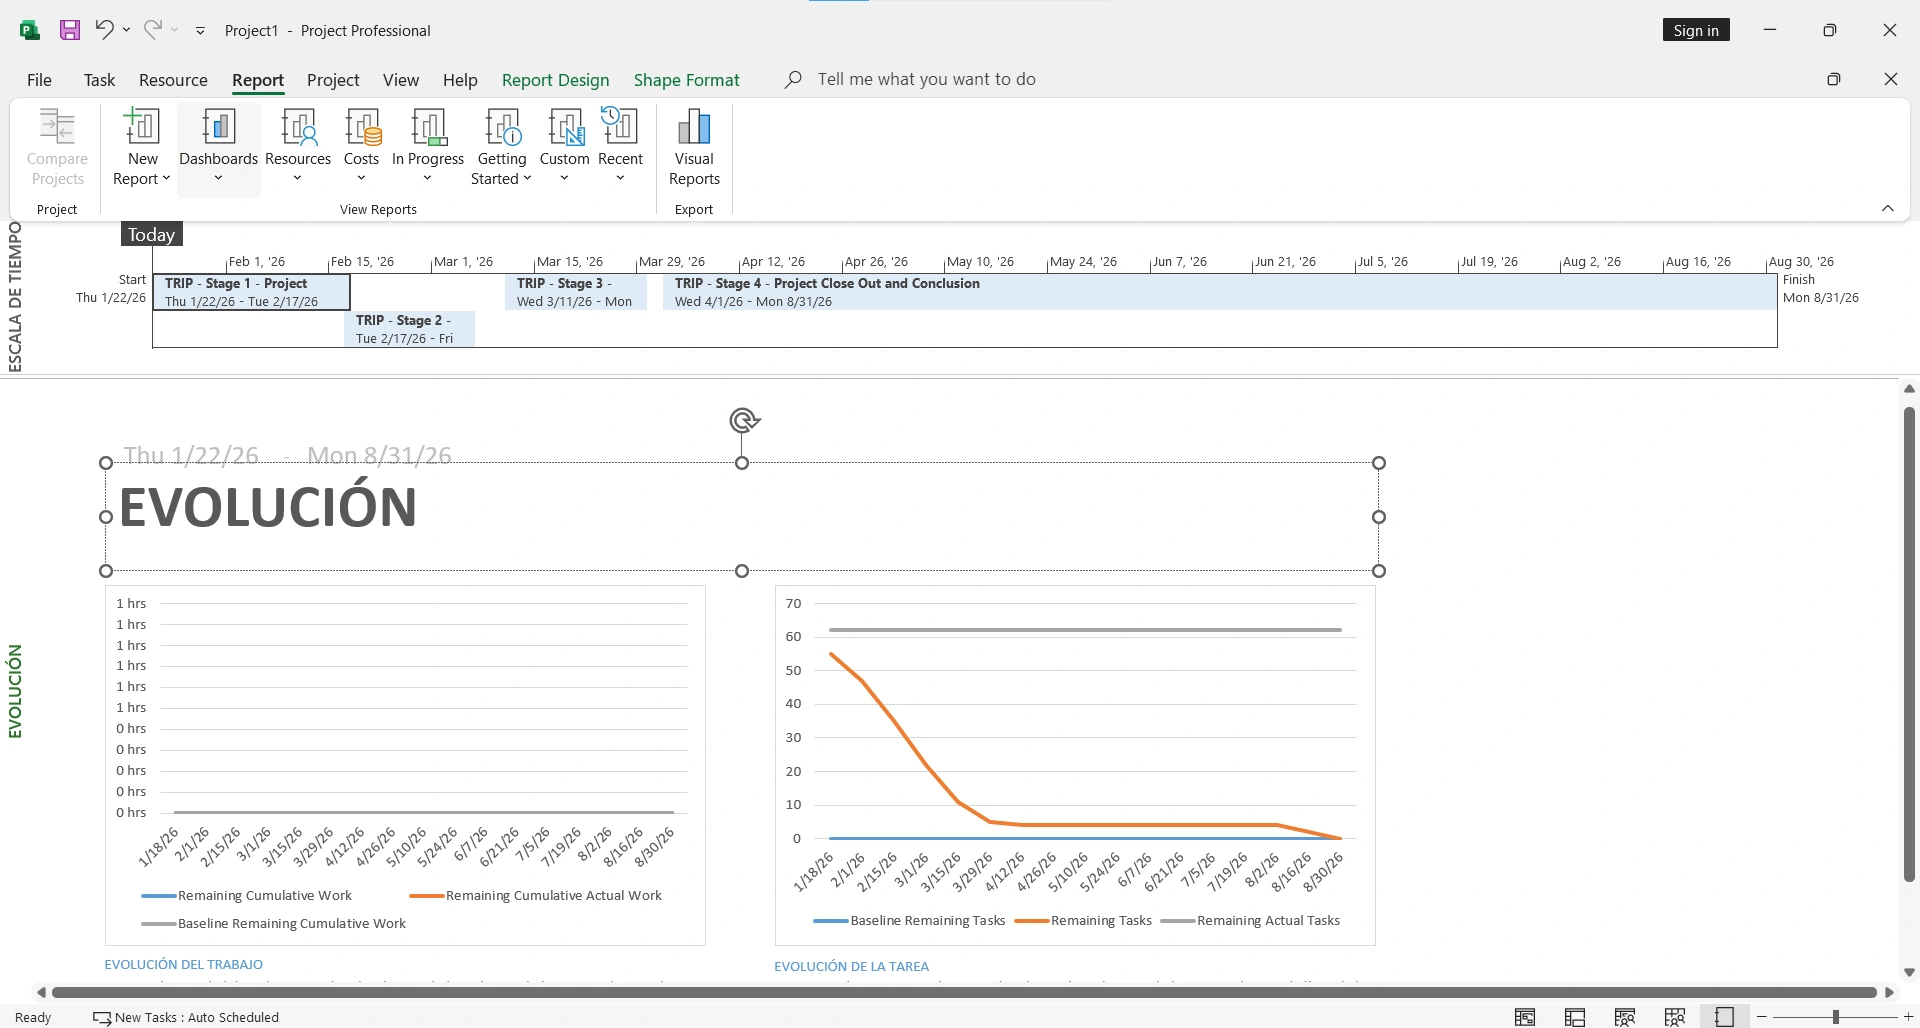
Visual Reports
Project includes predefined reports you can customize:
- Project Dashboard: Overall project status view
- Cost Report: Budget and expense breakdown
- Work Report: Hours assigned and worked by resource
- Burndown: Remaining work over time
8. Microsoft 365 Integrations
Project + Microsoft Teams
- Share projects directly in Teams channels
- Receive notifications about task changes
- Collaborate in real-time with your team
- Start meetings from project tasks
Project + Excel
- Export project data for custom analysis
- Import tasks from existing spreadsheets
- Create custom reports with Power Pivot
- Dynamically link data between Project and Excel
Project + Power BI
Connect Project with Power BI to create interactive executive dashboards:
- Visualize multiple projects in a single panel
- Create custom project management KPIs
- Share dashboards with stakeholders
- Automatic data refresh
9. Best Practices and Tips
Keep tasks small
Tasks ideally shouldn't last more than 2 weeks. Break down large tasks into manageable subtasks.
Use milestones to mark achievements
Milestones (duration = 0) help identify key points and facilitate stakeholder communication.
Set baselines before execution
Without a baseline, you won't be able to compare the original plan with actual progress.
Update the project regularly
Establish a rhythm (daily or weekly) to update progress and keep the plan current.
Avoid unnecessary date constraints
Constraints like "Must Start On" prevent Project from calculating the optimal schedule.
Don't ignore overallocations
A plan with overallocated resources isn't realistic and will lead to delays.
10. Frequently Asked Questions
What's the difference between Project Standard and Professional?
Project Professional includes all Standard features plus the ability to connect to Project Server/Project Online for enterprise collaboration, shared resource management, and project portfolios.
Can I use Microsoft Project on Mac?
Desktop Project is only available for Windows. However, you can use Project for the Web or Project Online through the browser on any operating system, including Mac.
How do I export a Gantt chart to PDF or image?
Go to File → Export → Create PDF/XPS Document. For images, you can use the "Copy Picture" function in the Task tab and paste it into any application.
Is it possible to manage Agile methodologies in Project?
Yes, although Project is primarily designed for traditional (waterfall) management, you can use it for Agile by creating sprints as phases, backlogs as task lists, and using Kanban boards in Project for the Web.
How much does Microsoft Project cost?
Project is available as a monthly subscription (Project Plan 1, 3, or 5) or as a one-time purchase (Project Standard or Professional). Prices vary by region. Check Project license offers for the best price.
🚀 Ready to Master Project Management?
Get Microsoft Project Professional 2024 with lifetime activation and access all advanced project management tools, professional Gantt charts, and enterprise features.
Get Microsoft Project Professional 2024✓ Lifetime license • ✓ Instant activation • ✓ Support included
Conclusion
Microsoft Project is an essential tool for any project management professional. From creating detailed schedules to managing resources and generating executive reports, Project provides everything you need to deliver successful projects.
Start with small projects to familiarize yourself with the interface, then explore advanced features like earned value analysis and Microsoft 365 integrations to maximize your productivity.